Main Tab#
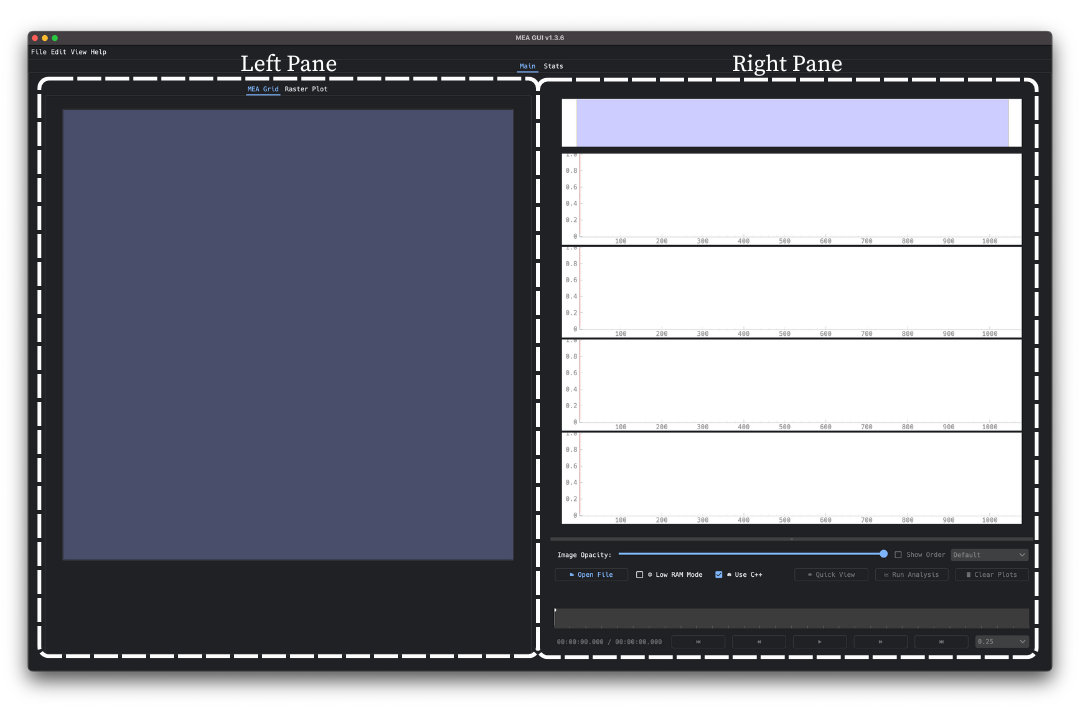
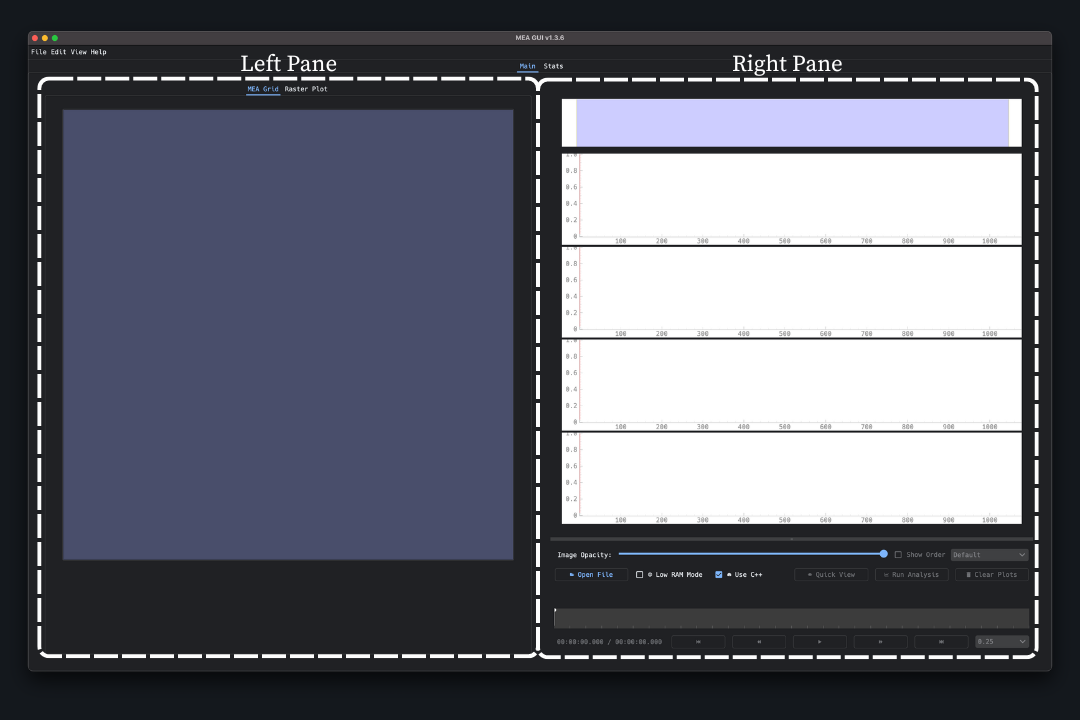
The Main Tab is the window that appears when you open the GUI, where most data interaction and analysis features are accessed. It is organized into two primary panes:
The Left Pane, which contains two tab views: the
MEA Gridfor selecting electrodes, and theRaster Plotfor reviewing spike activity.The Right Pane, which includes LFP trace plots in the top half, and the Control Panel in the bottom half for loading files, running analyses, and managing traces.
Each of these components works together to allow detailed inspection, grouping, and tracking of activity across the MEA.
For an introductory guide to running an analysis, start with the Walkthrough section.
For more information about interacting with the Left or Right Pane, see: